My 10 minute morning check
Every morning, before coffee finishes brewing, I open the dashboard and look at one thing: today's top 10. It is the day's best performing ads and products across every store we index. I am not looking for products to copy. I am looking for movement, which niches are heating up, which brands suddenly doubled their ad output, which product type keeps appearing three days in a row.
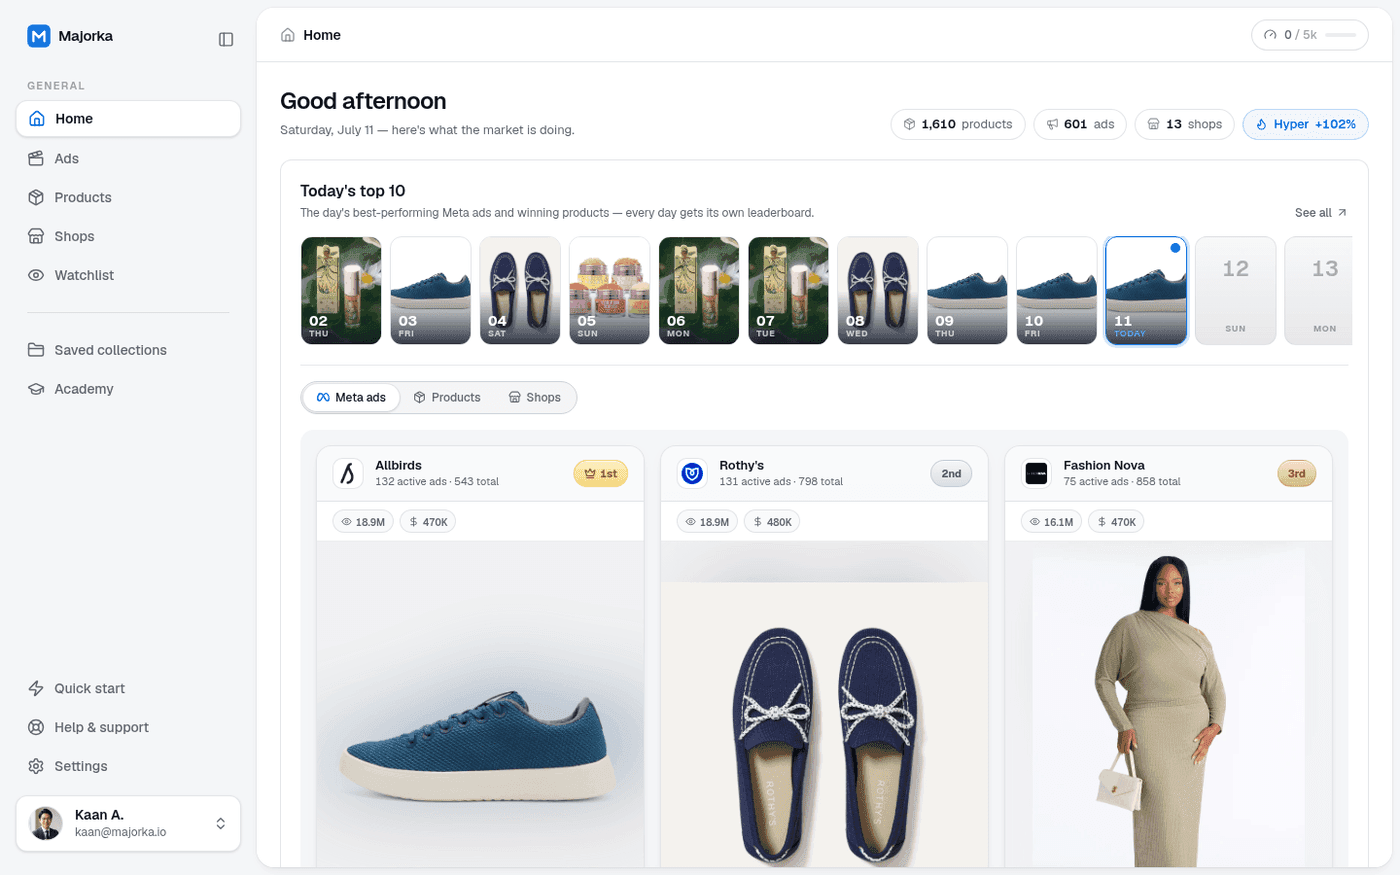
When the same product family shows up on the leaderboard multiple days running, that is not luck. Someone's media buyer is scaling because the numbers work. Which brings me to the fun part: opening up their whole store.
Opening up a store like a dollhouse
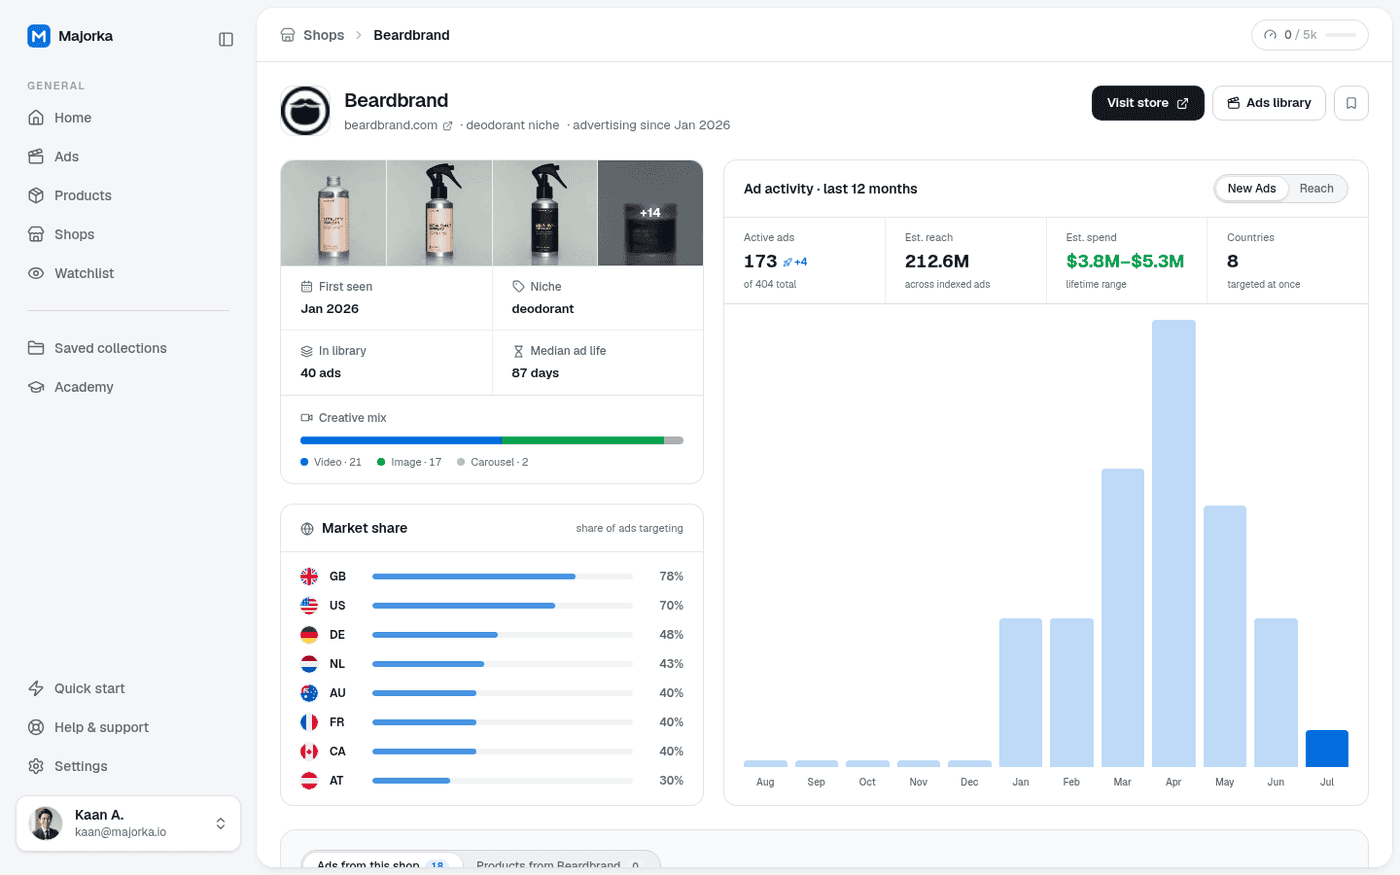
Click into any tracked shop and you get the full picture: how many ads they are running right now, estimated reach and lifetime spend, which countries they target, their creative mix, and a 12 month activity chart that shows exactly when they push and when they coast. Here is Beardbrand's page as I write this.
- 1
Read the median ad life first
Beardbrand's median ad is alive 87 days. That means their creatives are winners that keep earning, not tests getting killed. A store with a 12 day median ad life is still searching; a store at 80+ days has found its formula and is printing.
- 2
Check the market share bars
The country breakdown tells you where they have already won and where they have not bothered. GB at 78% and Netherlands at 43% means there is a proven product with a proven angle and a half-open market. That gap is an entry point.
- 3
Match ad spikes to their catalog
When the activity chart spikes, open their ads from that month and see which product they were pushing. Sustained spend on one product is the closest thing to seeing their revenue dashboard. Nobody funds a loser for three months straight.
The legal and ethical line
Everything here is public data: ad libraries, storefront pages, product sitemaps. That is fair game and every serious brand does it to each other. What crosses the line is copying creatives pixel for pixel or scraping customer data. Study strategy, never steal work.
Turning snooping into a decision
Research without a decision rule is just entertainment. Mine is simple: I move on a product when I can answer three questions. Is demand rising (order curve trending up)? Is there a market gap (a country or angle the incumbent ignores)? Can I be different in one obvious way (bundle, positioning, price bracket)? If any answer is no, I save the store to my watchlist and let the data keep collecting itself.
That is the whole system. Ten minutes in the morning, one deep dive when something moves, and a watchlist doing the boring surveillance for me. The stores that win are not run by people with better taste. They are run by people with better information, acted on earlier.
“Your competitors publish their strategy every day in the ad library. Reading it is a choice.”

Written by
MaximusFounder of Majorka
Built Majorka after years of running his own stores and being tired of guessing. Every post here comes from real tests, real ad spend, and real mistakes he paid for so you do not have to.
Share article
Put this playbook to work in 30 seconds
Paste any AliExpress link and see the order curve, velocity, and verdict for yourself. Plans from $39/mo.
See it in Majorka4.9/5 from 1,632 sellers
Orders · 24 wks
Scale23,491