[ Shops ]
Every store that is paying for ads, in one table
A directory of Shopify stores built from the Meta ads they actually run. Sort by active ads, 30-day growth, reach or catalog size, cut it with the segments below, and open any store for the full picture.
[ Core capabilities ]
What Shops does
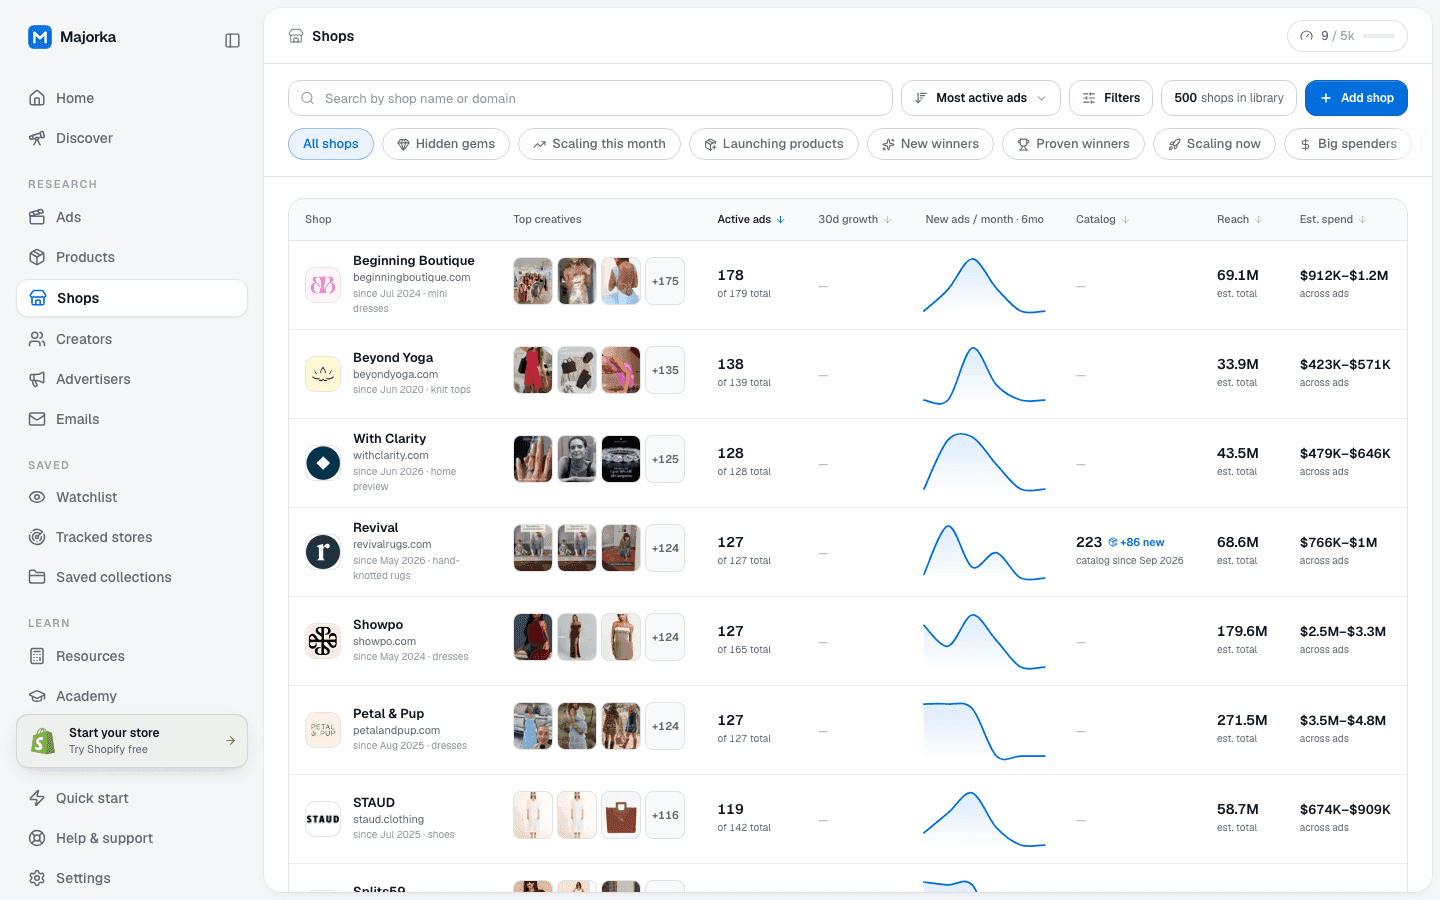
One row per advertising store: top creatives, active ads, 30d growth, new ads per month over six months, catalog, reach, spend and market share.
[ How you use it ]
Shops, in four steps
- 01
Pick a segment
Start from Scaling this month or Hidden gems rather than the whole index. Each chip states its threshold, so you know what the cut means before you read a row.
- 02
Sort for your question
Fastest growing for momentum, Most active ads for scale, Most products for catalog depth. Add a floor on active ads to drop stores that are only dabbling.
- 03
Read the row
Top creatives show what the store is running, the six-month sparkline shows when it started, and the catalog column shows whether products are still being added.
- 04
Open the store
The shop page adds the store profile, the twelve-month ad chart, tech stack, similar shops and a Track store button so the next launch reaches your tracker.
[ What’s measured vs estimated ]
Every number on this surface, with where it comes from
Where there is no measurement, the product shows nothing rather than a guess. The labels below are the ones on screen.
- MeasuredA count or a value read from the source.
- EstimatedDerived where the platform discloses nothing; labelled est.
- ModelledComputed from a stated method; carries an info hint.
- Active ads
- Meta's own running-ads count for the advertiser at the last crawl.
- of N total
- Ads Majorka has indexed for the domain.
- 30d growth
- Ads first seen in the last 30 days against the 30 before. Shows "new" when the prior window is empty, never a made-up percentage.
- New ads / month · 6mo
- Launches per month over the indexed ads.
- Catalog
- Products counted from the store’s public products feed; a capped walk is shown as a lower bound.
- Reach (est. total)
- A sum of per-ad estimates. Meta discloses real reach only for its EU transparency set, and those ads are marked.
- Est. spend
- Modelled from ad reach, placement mix and niche CPM benchmarks, shown as a range.
- Market share
- Share of indexed ads targeting each country; targeting is an estimate unless Meta disclosed it.
[ Keep going ]
Related features and free tools
- FeatureStore profilePlatform, currency, locale, catalog size and age, best sellers, pixels, socials and tech stack sit above the store’s twelve-month ad chart, its Meta ads, its products and the shops that run the same playbook.Open
- FeatureStore trackerTrack any advertiser and get its new ads, testing batches, landing pages, opening lines and stack on one page, with a +N new since you last looked pill that does the remembering for you.Open
- Free toolCompetitor ads finderActive Meta ads for a domain, from our own index.Open
- Free toolShopify apps detectorThe apps a storefront exposes in its own code, by category.Open
From the Meta ads we index. A store appears in the directory when we hold Meta ads for its domain, and the row is a live aggregate over those ads. You can also submit a domain with Add shop and it is pulled in.
Five or more ads launched in the last 30 days and at least double the number launched in the 30 days before that, both counted from ads we indexed in each window. The tooltip on the chip says the same thing.
It is an estimate unless Meta disclosed it. Meta publishes real reach only for ads in its EU transparency set; those are flagged, and everything else carries our estimate. The column is labelled "est. total" for that reason.
Because the prior 30-day window had no launches, so there is no ratio to show. We print "new" when the store launched something this window and a dash when nothing moved, instead of inventing a percentage.
Yes. Filter sets can be saved and reopened, and any store can be tracked from its row or its shop page so its new ads land in your tracker.