[ Similar shops ]
Who else is running this playbook?
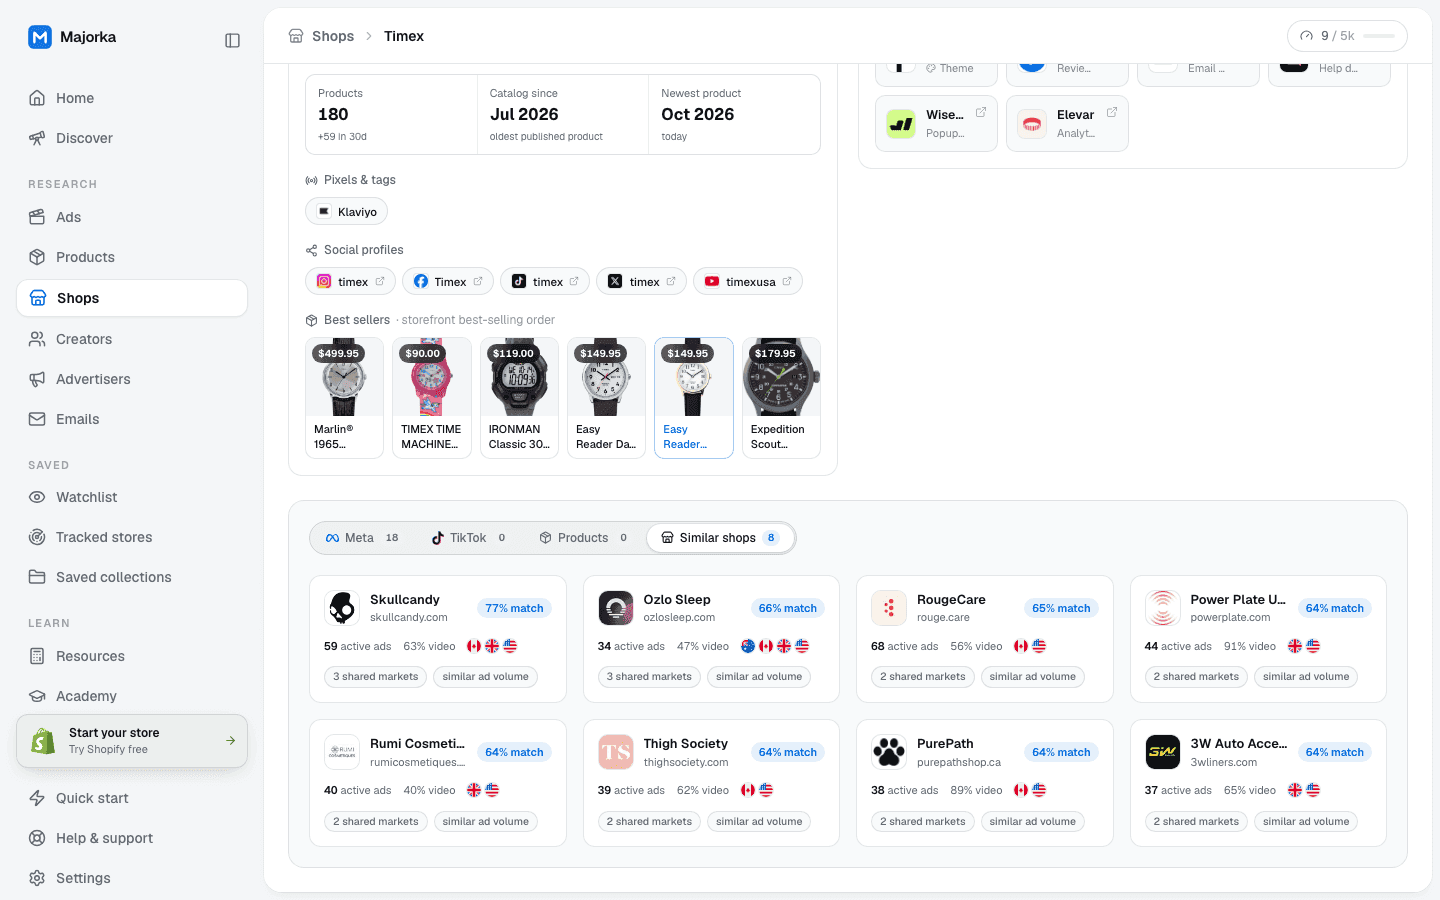
For any store, the advertisers that share its niche, its target markets and its ad volume, scored by a fixed formula you can read, with the reasons that scored printed on each card.
[ Core capabilities ]
What Similar shops does
A weighted sum over three things measured per shop: niche match, overlap of targeted countries and closeness of active-ad counts.
The formula, as implemented
- 0.45 · niche match
- 1 when the canonical niches are equal, 0.5 when either side has no niche (unknown is not different), else 0
- 0.35 · markets
- Jaccard overlap of the two targeted-country sets
- 0.20 · ad volume
- 1 − |log10(a+1) − log10(b+1)| / 3, clamped to 0..1; shops within a decade of each other score at least 0.67
[ How you use it ]
Similar shops, in four steps
- 01
Open a store you already know
A competitor, a supplier’s brand customer, a store you found in the directory. Its page carries the Similar shops tab.
- 02
Read the reasons, then the score
A 77% match with same niche and three shared markets means something different from a 64% match on ad volume alone. The card says which.
- 03
Walk the graph
Each card opens the matched store, which has its own Similar shops tab. Three hops usually maps a niche.
- 04
Track the ones that matter
Track store on any page sends its launches to the tracker; the bookmark files it into a collection.
[ What’s measured vs estimated ]
Every number on this surface, with where it comes from
Where there is no measurement, the product shows nothing rather than a guess. The labels below are the ones on screen.
- MeasuredA count or a value read from the source.
- EstimatedDerived where the platform discloses nothing; labelled est.
- Niche
- The niche label held for the shop, canonicalised (apparel and clothing are the same niche; placeholders such as "winner" count as unknown).
- Shared markets
- Targeted countries come from the indexed ads and are a targeting estimate unless Meta disclosed them.
- Active ads / similar ad volume
- Meta's own running-ads count for each advertiser at the last crawl.
- % video
- Share of indexed ads captured as video.
- N% match
- A deterministic function of the three inputs above. Nothing is learned, nothing is sampled.
[ Keep going ]
Related features and free tools
- FeatureStore profilePlatform, currency, locale, catalog size and age, best sellers, pixels, socials and tech stack sit above the store’s twelve-month ad chart, its Meta ads, its products and the shops that run the same playbook.Open
- FeatureShopsA directory of Shopify stores built from the Meta ads they actually run. Sort by active ads, 30-day growth, reach or catalog size, cut it with the segments below, and open any store for the full picture.Open
- Free toolCompetitor ads finderActive Meta ads for a domain, from our own index.Open
- Free toolShopify apps detectorThe apps a storefront exposes in its own code, by category.Open
No. It is a fixed formula over niche, targeted markets and active-ad volume, with the weights printed on this page. The same two shops always produce the same score.
Because unknown is not the same as different. A missing niche on either side scores half the niche weight rather than zero, so a well-indexed shop is not punished for a gap in our labels.
The highest-scoring advertisers in the directory for that store, each with its reasons. The candidates are every Meta-advertising domain in the library.
No. We do not hold measured traffic for stores and would not score on a modelled number. The three inputs are things we measure or that the ads themselves state.
The store detail is available over the public API and MCP server; similar shops are an in-app view of the same directory.